
In concrete construction, anchorage refers to the way a steel element (rebar, bolt, stud, or other fastener) is fixed into concrete so that forces can be safely transferred from the connected member into the concrete.
Designing steel‑to‑concrete anchoring in 3D means modeling the entire connection (steel base plate, anchor rods, and surrounding concrete block) as a three‑dimensional finite‑element system so that force paths, stresses, and failure modes are captured more realistically than in traditional 2D or hand‑calculation methods.
Introduction to Anchorage in Concrete
Anchorage in concrete ensures secure bonding between concrete and embedded structural elements.
It allows loads to transfer safely, preventing slippage or pullout under stress.
Proper anchorage is essential for structural stability, especially in high-load zones.
Without it, even strong concrete structures can fail prematurely.
The software then performs non‑linear 3D analysis to compute stress and strain distributions in both concrete and steel, including local effects near edges, corners, and anchor groups.
Traditional 2D methods assume simplified load paths and uniform stress distributions, which can be unconservative for complex or edge‑sensitive anchor layouts. 3D modeling reveals stress concentrations, identifies weak zones in reinforcement, and allows optimization of anchor placement, base‑plate stiffness, and shear‑transfer mechanisms (friction, shear lugs, anchor shear).
Design Steel-to-Concrete Anchoring in 3D
Designing accurate steel‑to‑concrete anchoring in 3D means modeling the full interaction between a steel member (column, bracket, wall anchor, etc.) and a real reinforced‑concrete block, including edge‑sensitive zones, realistic reinforcement layouts, and all available shear‑transfer mechanisms (anchors, shear lugs, and friction).

This approach allows you to capture complex stress flows and optimize both steel and concrete, while still using Eurocode and AISC formulas for code‑based checks of anchors, base plates, and rebars.
1. Scope of 3D anchoring design
The method covers anchoring steel structures to concrete foundations, walls, and other members, using either cast‑in plates, pedestals, or non‑standard foundation geometries. It is especially useful for edge‑sensitive conditions (e.g., anchors close to free edges or corners), where simplified 2D methods can miss critical concrete breakout or reinforcement yielding.
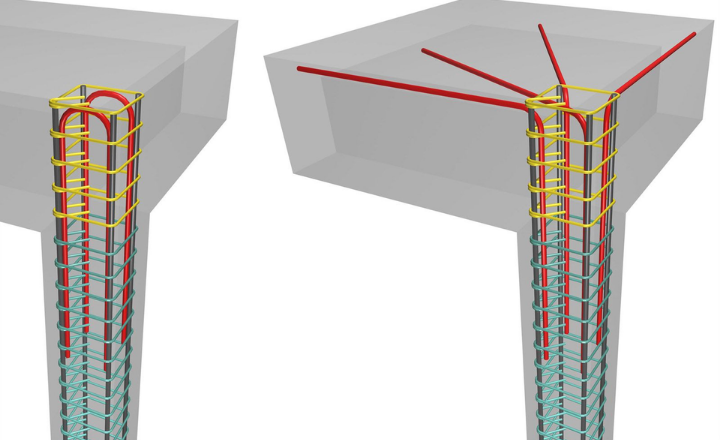
In 3D, the concrete block is modeled with its real reinforcement (layers, stirrups, dowels), so the software can compute stresses and strains in both concrete and rebars under realistic load combinations.
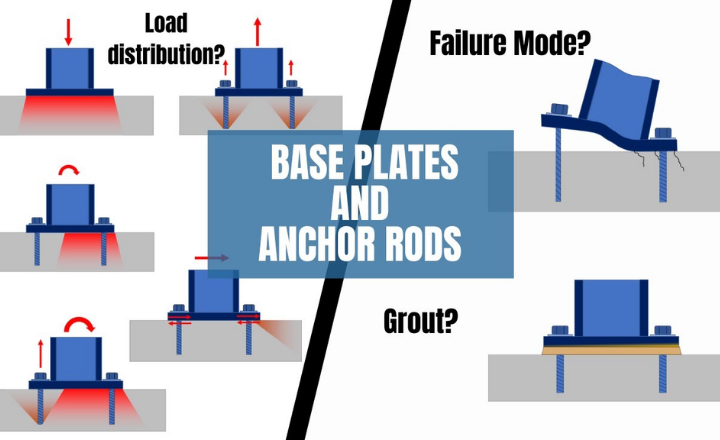
2. Shear transfer mechanisms
Shear between steel and concrete can be carried by three main paths, which can be combined or used separately depending on detailing and code rules:
- Friction at the base plate–concrete interface:
Eurocode EN 1993‑1‑8 allows shear to be resisted partly by friction between the base plate and grout/concrete, provided there is sufficient clamping force (from anchor pretension or dead load). - Shear lugs (shear keys):
A welded steel lug or stub embedded into the concrete can carry the majority of shear, especially when anchor‑hole tolerances or expected slip make pure anchor‑shear design impractical. - Anchors in shear:
Anchors can be designed to resist shear directly, but their contribution is often limited by bending of the rod and concrete breakout; Eurocode and ACI‑based formulas are used to compute their shear capacity and concrete‑failure modes.
In a 3D model, the software distributes shear among these mechanisms based on stiffness and contact conditions, then checks each one against code‑based resistances.
3. Using Eurocode and AISC for checks
For steel parts and anchors, AISC 360‑10/16/22‑type formulas are typically used to check tensile and shear capacity of anchor rods, base‑plate bending, and welds. For concrete and reinforcement, Eurocode‑based approaches (EN 1992‑1‑1, EN 1993‑1‑8, EN 1994‑1‑1) are applied to verify concrete compression, anchor pullout, edge‑breakout, and rebar yielding.
The 3D analysis computes internal forces and stresses, while the code checks are applied as post‑processing verifications:
- Concrete and anchor resistances (pullout, breakout, pry‑out, splitting).
- Steel base‑plate and anchor‑rod capacities (yielding, rupture, welds).
- Reinforcement strength and crack‑control checks in the concrete block.
4. Identifying stress‑flow mechanisms
A key advantage of 3D modeling is that you can visualize how stresses flow from the steel member into the concrete and through the reinforcement.
- Concrete stress paths:
You can see compressive “struts” under the base plate, tensile zones near edges, and stress concentrations around anchor heads or shear lugs. - Rebar stress and strain:
The model computes axial and shear stresses in rebars, allowing you to identify weak zones (e.g., insufficient anchorage length, lack of transverse reinforcement near edges) and adjust bar spacing, diameter, or detailing.
By using section views and stress‑contour plots, you can interpret whether the reinforcement is effectively tying the concrete together or whether local yielding or cracking will govern the behavior.
5. How to structure your own exploration (without plagiarism)
To write your own original content on this topic, focus on:
- Describing your chosen connection type (e.g., column base plate on a pedestal, wall anchor, bracket on a wall) and its real geometry.
- Explaining how you modeled the concrete block and reinforcement (layers, stirrups, dowels) and why that matters for edge‑sensitive cases.
- Discuss how shear is shared among friction, shear lugs, and anchors in your example, using Eurocode or AISC formulas in your own words.
- Interpreting stress‑flow diagrams from your 3D model (compressive struts, tensile ties, rebar stress hotspots) and relating them to design decisions (more reinforcement, thicker base plate, larger edge distance, etc.).
Common pitfalls in edge-sensitive anchoring design
Edge‑sensitive anchoring is one of the most error‑prone parts of steel‑to‑concrete design because small changes in geometry or detailing can drastically reduce capacity. Below are common pitfalls, with brief explanations you can adapt into your own wording.
1. Underestimating edge‑distance effects
When anchors are placed close to an edge, the concrete breakout cone or edge‑failure zone is truncated, which sharply reduces tension and shear capacity. A frequent mistake is using generic “minimum edge distance” rules without recalculating reduced edge‑failure resistance for the actual layout.
2. Ignoring 3D stress redistribution
In edge‑sensitive cases, stress paths are highly three‑dimensional: the load may shift toward the interior of the member or concentrate at the corner. Many designers still rely on 2D hand calculations and miss blow‑out, corner‑spalling, or uneven load sharing among anchors.
3. Overlooking supplementary reinforcement
Edge‑close anchors often require supplementary reinforcement (stirrups, U‑bars, or hairpins) to tie the breakout zone and prevent sudden brittle failure. A common pitfall is either omitting this reinforcement or detailing it in a way that does not align with the actual stress flow (wrong location, spacing, or anchorage length).
4. Incorrect shear‑transfer assumptions
Near an edge, shear can be carried by anchors, friction, or shear lugs, but designers often assume anchors alone can resist the full shear without checking:
- Concrete edge‑breakout under shear.
- Whether friction or a shear lug is actually engaged (e.g., no clamping force, no proper lug embedment).
This leads to unconservative designs where the concrete fails before the steel yields.
5. Poor installation and detailing practices
Even a well‑designed edge‑sensitive anchorage can fail due to:
- Drilling too shallow or at the wrong angle, which reduces effective embedment and edge distance.
- Not cleaning drilled holes, which weakens bonded anchors.
- Misplacing anchors in the field so that edge distances become smaller than assumed in design.
6. Using unreinforced‑concrete assumptions when reinforcement exists
Some designers conservatively assume the concrete is unreinforced near the edge, even when reinforcement is present, which leads to overly conservative or unnecessarily complex designs. A better approach is to model the real reinforcement in 3D and let the analysis show how much it actually contributes.
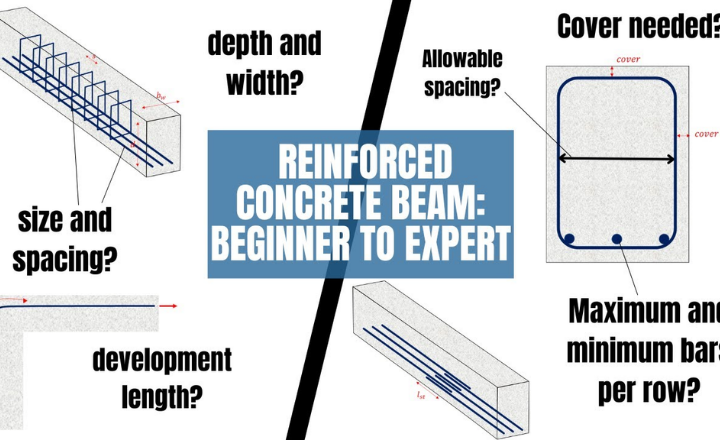
Minimum edge distance requirements per ACI 318
ACI 318 does not give a single universal “minimum edge distance” for all anchors; instead, it sets minimums that depend on anchor type, installation method, and whether supplementary reinforcement is used. Below are the key practical rules you can use.
1. Cast‑in headed anchors (no torque)
For cast‑in headed anchors that are not torqued, ACI 318‑14 allows a minimum edge distance equal to the minimum concrete cover (for example, about 1.5 × bolt diameter for typical cover). This is often used for non‑critical or lightly loaded applications where the anchor is not pretensioned.
2. Cast‑in anchors without special testing
When no qualifying test data are available, ACI 318‑14 Section 17.7.2 specifies a minimum edge distance of 6 × anchor diameter (6da) for cast‑in anchors. This is a conservative default to control edge‑breakout and splitting in the absence of manufacturer‑specific approvals.
3. Adhesive (bonded) anchors
For adhesive (chemical) anchors, ACI 318‑19 Section 17.9.2 requires a minimum edge distance of 6 × anchor diameter (6da) in many common configurations. This helps avoid edge‑splitting and ensures the bond length is effective near the free surface.
4. General practical guideline
Many guides summarize ACI‑aligned practice by recommending at least 2.5 × bolt diameter as a working minimum edge distance for typical anchor‑bolt layouts, but this is not a code‑mandated value and should be checked against the specific ACI section for your anchor type and loading.
5. What to remember in design
- Always check ACI 318 Chapter 17 (Anchoring to Concrete) for your version (e.g., 318‑14 or 318‑19).
- If you use supplementary reinforcement (stirrups, U‑bars) around the anchor group, some edge‑distance relaxations may be allowed, but they still must satisfy the applicable ACI provisions and project‑specific approvals.
Visualize reinforcement to identify weak points
Visualizing reinforcement in a 3D model helps you see where rebars are under high stress or strain, making it easy to spot weak points such as regions with sparse or poorly anchored bars. By coloring rebars according to stress levels and using section views, you can identify zones likely to yield first or where concrete may crack without adequate tying, then adjust bar spacing, diameter, or detailing to strengthen those areas.
1. Visualize reinforcement to find weak points
In a 3D model, you draw the real reinforcement layout: longitudinal bars, stirrups, U‑bars, and any mesh around anchors or shear lugs. By coloring the rebars according to stress or strain, you can quickly see which bars are close to yielding (high stress) and which zones have almost no load (low stress), indicating over‑designed or under‑designed regions.
For example, if stirrups near the base of a pedestal show very high stress while upper stirrups are almost inactive, this suggests the critical shear zone is concentrated at the bottom and the upper stirrups may be unnecessary or poorly spaced.
2. Detailed analysis of concrete and steel under real loading
Using non‑linear 3D analysis, the model computes stresses and strains in both concrete and steel rebars under realistic load combinations (axial force, bending, shear, temperature, etc.). You can then:
- Plot concrete principal stresses to see compression “struts” and tension zones.
- Plot steel‑bar stresses to check whether rebars reach yield or remain elastic.
This helps you interpret whether failure will be concrete‑dominated (crushing, cracking, edge‑breakout) or steel‑dominated (yielding of rebars or anchor rods).
3. Use section views to identify critical failures
By cutting section planes through the 3D model (vertical, horizontal, or diagonal), you can inspect internal behavior in slices. In each section you can:[
- See how cracks or high‑tensile‑stress zones develop near edges, corners, or around anchor groups.
- Observe how rebars cross these zones and whether they are dense enough to tie the concrete together.
If a section shows a wide tensile zone with very few or poorly anchored rebars, that location is a likely weak point and may need more reinforcement or a change in bar layout.
4. Optimize materials and prevent overdesign
Once you can visualize stress and strain patterns, you can reduce or redistribute materials without losing safety:
- Reduce concrete where stresses are low (e.g., upper parts of a pedestal that carry little load).
- Adjust rebar spacing or diameter where stress is high or uneven.
- Tune base‑plate stiffness (thickness, stiffeners) so that load spreads more evenly into the concrete, avoiding local crushing or excessive anchor demand.
By matching the real reinforcement and accurate base‑plate stiffness in the model, you avoid conservative hand‑calculation assumptions and design a more efficient, yet still safe, connection.
Common failure modes visualized in 3D RC animations
1. Flexural (bending) failure
In bending, 3D animations typically show:
- A crack band developing along the tension face of the member, starting at mid‑span and propagating toward supports.
- High tensile stresses in the bottom reinforcement and compressive stresses in the top concrete, with eventual yielding of steel and crushing of the concrete compression zone.
This mode is easy to recognize in an animation because cracks open progressively under increasing load and the member deflects visibly downward.
2. Shear failure
Shear failures appear as diagonal cracks that run from the support toward mid‑height or mid‑depth of the member. In 3D:
- You see a shear‑crack band cutting through the web, often accompanied by sudden widening of cracks and rapid loss of stiffness.
- If stirrups are insufficient, the animation shows wide diagonal openings with little warning, while adequate stirrups keep the crack spacing smaller and more controlled.
In anchorage zones, shear failure can also show as edge‑breakout or corner spalling, where a wedge of concrete separates near an anchor group.
3. Anchorage and bond failure
Around anchor rods, base plates, or lapped bars, 3D animations highlight:
- Slip between steel and concrete, with cracks forming along the bar surface or near the anchor head.
- Pullout or concrete cone breakout, where a conical or prismatic block of concrete detaches from the main body, often starting at the anchor head and propagating outward.
Edge‑sensitive cases show how reduced edge distance concentrates stresses and leads to early splitting or blow‑out near the free surface.
4. Local crushing and compression failure
In columns or heavily loaded regions, 3D stress plots and animations reveal:
- High compressive stresses in concrete near supports or under concentrated loads.
- Crushing zones that start as small high‑stress spots and grow into a crushed band, sometimes accompanied by buckling of longitudinal bars if confinement is poor.
These regions often appear as dense, red‑colored clusters in stress‑contour views.
5. Reinforcement‑yielding and ductile vs brittle behavior
By coloring rebars according to stress, 3D animations distinguish:
- Ductile response: gradual yielding of longitudinal bars and stirrups, with cracks spreading over a larger zone and large deformations before collapse.
- Brittle response: sudden concrete failure (shear, edge‑breakout, or splitting) with little prior yielding, shown as abrupt crack opening and rapid loss of load‑carrying capacity.
Real-world RC structure collapse cases with 3D reconstructions
Several real‑world reinforced‑concrete (RC) structure collapses have been reconstructed in 3D to understand failure mechanisms, validate models, and improve design codes. These reconstructions combine field data, photos, LiDAR scans, or finite‑element simulations to show how damage spreads and where the structure first gave way.
1. Seismic collapse of RC frames
Researchers have reconstructed strong‑column–weak‑beam and strong‑beam–weak‑column RC frames under earthquake loading using 3D distinct‑element or finite‑element models. In these simulations, the 3D animations show how plastic hinges form in columns or beams, how cracks propagate, and how the building collapses progressively when certain members fail first.
2. Progressive collapse of RC frame buildings
Studies on progressive collapse of RC frame buildings use 3D finite‑element models to remove a column or critical element and then simulate how the rest of the structure redistributes load. The 3D visualizations highlight which regions are most vulnerable (e.g., corner columns, transfer slabs) and how failure spreads through beams, slabs, and joints, helping to identify weak links in the load path.
3. Post‑earthquake building damage visualization
After earthquakes, engineers have used 3D point‑cloud data (from LiDAR or photogrammetry) to reconstruct damaged RC buildings and visualize cracks, tilting, and partial collapses. These 3D models allow them to map damage severity, check whether failure started at soft‑story columns, weak joints, or poorly detailed anchorage zones, and compare the observed collapse with numerical predictions.
4. Dome and masonry‑concrete structures
In historic or mixed RC‑masonry structures, 3D reconstructions have been used to analyze dome collapses or apse failures after seismic events. By combining old photos, survey data, and modern scans, researchers build 3D models that show how thrust lines and stress paths changed, leading to cracking and eventual collapse of the dome or supporting walls.
Transfer Design Data in just a few Clicks
1. What does “transfer design data in just a few clicks” means
In this workflow, the Connection app already contains:
- Base‑plate geometry (size, thickness, stiffeners).
- Anchor layout (diameters, positions, embedment).
- Material properties (steel grade, concrete class).
- Loads (axial force, moments, shear).
With a simple command (button or menu item), all this information is exported or linked to the Detail module, so you do not have to redraw the base plate, re‑enter anchor positions, or re‑type loads.
2. Import baseplate and anchors directly
Instead of manually sketching the base plate and anchors in the Detail model, you import them as a complete group from the Connection app. This preserves:
- Exact anchor spacing and edge distances.
- Orientation and elevation of the base plate.
- Load directions and magnitudes.
This reduces the risk of misplaced anchors or wrong load values, which are common sources of errors in hand‑transferred models.
3. Transfer geometry, materials, and loads
The data‑exchange link carries:
- Geometry: member sizes, plate shapes, anchor locations.
- Materials: concrete strength, steel yield stress, rebar grade.
- Loads: combinations of axial force, bending, and shear that the connection must resist.
Once imported, the Detail module can immediately perform non‑linear 3D analysis using the real reinforcement and accurate base‑plate stiffness, without any manual re‑entry.
4. Add reinforcement, analyze, and optimize in Detail
In the Detail environment you can:
- Draw or modify real reinforcement (longitudinal bars, stirrups, U‑bars, hairpins) around the anchor group.
- Run 3D finite‑element analysis to compute stresses and strains in concrete and steel under the imported loads.
- Use section views and color‑coded results to identify weak zones (high‑stress rebars, edge‑breakout regions, local crushing).
Based on these results, you can optimize the design:
- Adjust rebar spacing or diameter.
- Change base‑plate thickness or stiffeners.
- Modify anchor layout or edge distances.
5. Use data exchange to eliminate rework and errors
By keeping the Connection and Detail models linked, any change in the connection (new anchor positions, updated loads) can be pushed back to Detail with another click, rather than being manually corrected. This:
- Reduces rework when design iterations occur.
- Lowers the chance of copy‑paste mistakes or forgotten updates.
Conclusion
Anchoring design in reinforced concrete ensures safe transfer of forces between steel and concrete by properly detailing embedment, edge distances, and reinforcement around anchors. A well‑designed anchorage avoids brittle failures and allows the structure to behave as intended under real loading conditions.